如何使用 Matplotlib 绘制直方图:
import matplotlib.pyplot as plt

import numpy as np

from matplotlib import colors

from matplotlib.ticker import PercentFormatter

# Create a random number generator with a fixed seed for reproducibility

rng = np.random.default_rng(19680801)
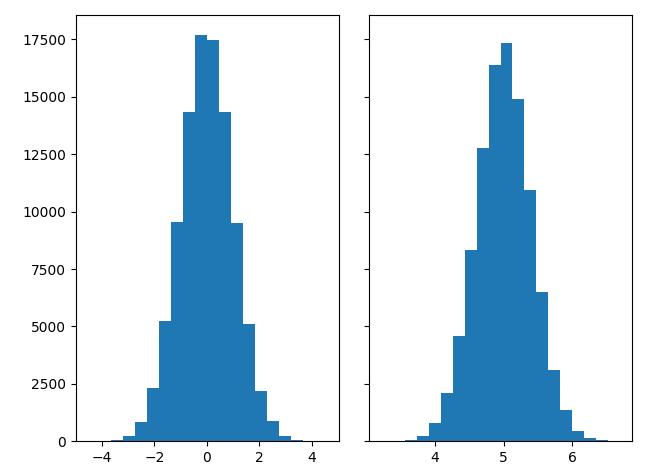
要生成一维直方图,我们只需要一个数字向量。对于二维直方图,我们需要第二个向量。我们将在下面生成两者,并显示每个向量的直方图。
N_points = 100000

n_bins = 20

# Generate two normal distributions

dist1 = rng.standard_normal(N_points)

dist2 = 0.4 * rng.standard_normal(N_points) + 5

fig, axs = plt.subplots(1, 2, sharey=True, tight_layout=True)

# We can set the number of bins with the *bins* keyword argument.

axs[0].hist(dist1, bins=n_bins)

axs[1].hist(dist2, bins=n_bins)